Overview
HDI Solutions, LLC works with state agencies to take crash record data and turn it into actionable, insightful and regulatory useful data. HDI takes the raw data provided and delivers it in a way that helps agencies make sense of the information. Through data entry, coding, matching and use of analysis, data is broken down into useful and reportable segments.
HDI accomplishes this using descriptive, diagnostic, predictive and prescriptive analytics. Essentially, HDI can help state agencies and local governments understand the what, why, how and what is next of the data they have on hand and continue to collect.
This process allows crash records data, no matter if it’s written or entered electronically, to be used for the well-being of citizenry across cities and states nationwide.

Crash Records Data Management – Producing Actionable Insights
Crash record data is utilized to provide statistics regarding motor vehicle fatalities, meet the federally mandated reporting requirements of Fatality Analysis Reporting System (FARS) – a division of the National Highway Traffic Safety Administration (NHTSA) – and support the efforts of traffic engineers state-wide.
HDI’s work to turn officer narrative and diagram information from crash reports into codes helps the Texas Department of Transportation to make decisions such as where to add traffic signals and when to engage in roadway repairs and other construction projects. HDI provides crash data to TxDOT within 48 hours of receipt for the state’s more than 625,000 annual traffic crashes to ensure up-to-date data is always available. This data is delivered electronically via web services in XML format.
How HDI’s Coding System Works
The five methodologies can be broken into three categories: reactive, event-based and proactive approaches.
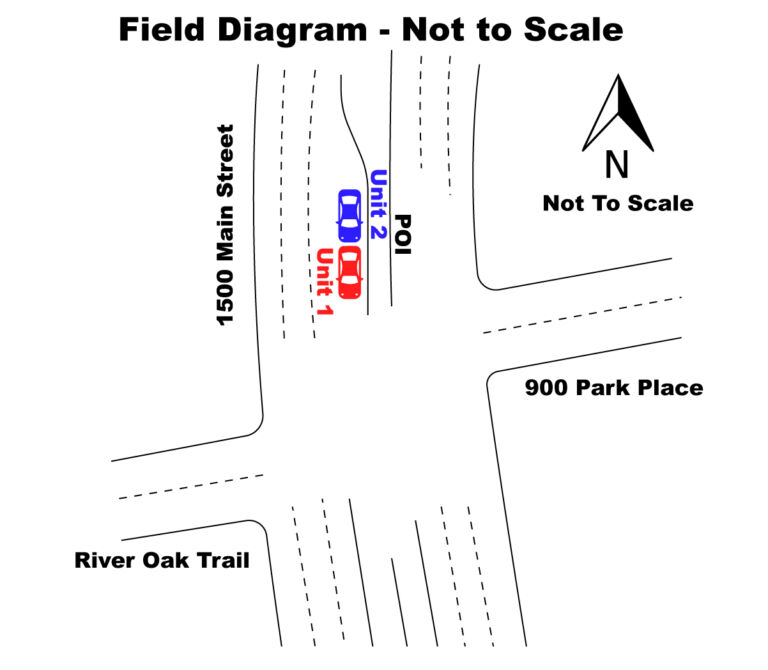
HDI reviews written officer narrative data and pictorial diagram information
Investigator’s Narrative
Unit 1 was stopped in traffic at the intersection of Main Street and Park Avenue awaiting the traffic signal. While stopped, the driver of Unit 1 reported that Unit 2 ran into the back of her vehicle. When the driver of Unit 1 exited her vehicle to check on the damage, the driver of Unit 2 reversed his vehicle, performed a U-Turn maneuver and proceeded North on Main Street. The driver of Unit 2 subsequently lost control of his vehicle, exited the roadway and struck a tree and a mailbox before going down an embankment. It was at this time that the driver of Unit 2 was ejected from his vehicle. Upon arrival of medical personnel on the scene, the driver of Unit 2 was attended and administered a breathalyzer. The results of the test are pending as of the date of this report’s submission. A supplement will be issued once a BAC can be assigned to the driver of Unit 2.
Data is coded into 20 different fields to use for reporting
Customized data is produced including, but not limited to:
- First Harmful Event
- First Harmful Event Involvement
- Collision Category
- Manner of Collision
- Direction of Travel
- Intersection Related
- Roadway Part
- Road Class
- Roadway Relation
- Physical Feature 1
- Physical Feature 2
- Bridge Detail
- Other Factors
- Object Struck
- E-Scooter Identification
- Autonomous Unit Identification
- Pedestrian Location
- Pedestrian Action
- Pedalcyclist Location
Data Returned Electronically
Data is returned to the agency electronically in XML format allowing agencies to import data into internal systems for further analysis, decision making and external reporting.